Compiling outputs from lists
Value
compile_data converts the outputs of fit_many into a form more readily usable for analysis. Can be used to create dataframe of all fitted parameters, a list of model outputs, a list of graphs for plotting. This function is NOT restricted to compiling outputs from plantecophystools but could be used to compile elements from ANY list of lists.
Examples
# \donttest{
# Read in your data
# Note that this data is coming from data supplied by the package
# hence the complicated argument in read.csv()
# This dataset is a CO2 by light response curve for a single sunflower
data <- read.csv(system.file("extdata", "A_Ci_Q_data_1.csv",
package = "photosynthesis"
))
# Define a grouping factor based on light intensity to split the ACi
# curves
data$Q_2 <- as.factor((round(data$Qin, digits = 0)))
# Convert leaf temperature to K
data$T_leaf <- data$Tleaf + 273.15
# Fit many curves
fits <- fit_many(
data = data,
varnames = list(
A_net = "A",
T_leaf = "T_leaf",
C_i = "Ci",
PPFD = "Qin"
),
funct = fit_aci_response,
group = "Q_2"
)
#> Warning: `fit_many()` was deprecated in photosynthesis 2.1.3.
#>
|
| | 0%
|
|========= | 12%
|
|================== | 25%
|
|========================== | 38%
|
|=================================== | 50%
|
|============================================ | 62%
|
|==================================================== | 75%
|
|============================================================= | 88%
|
|======================================================================| 100%
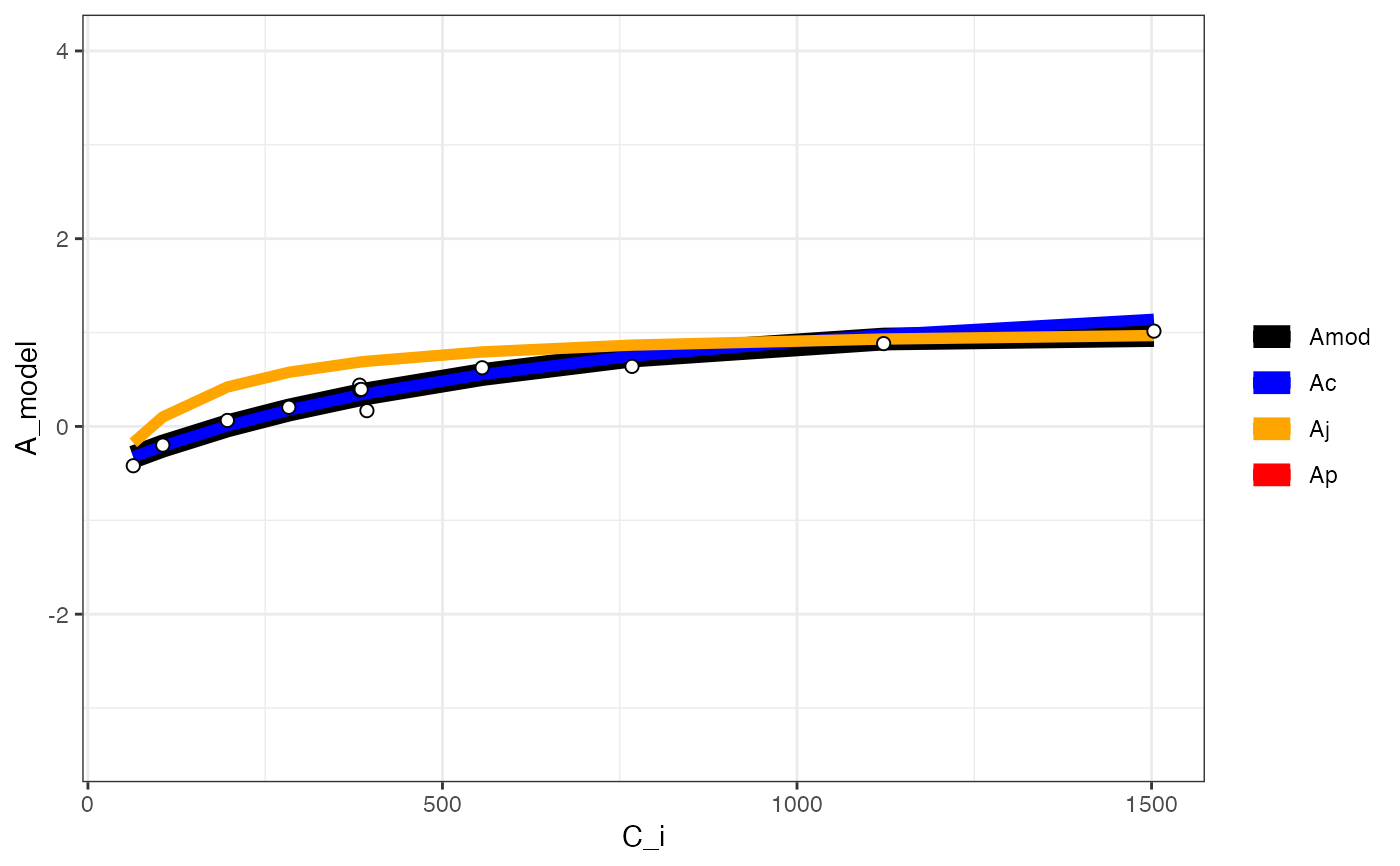
# Compile graphs into a list for plotting
fits_graphs <- compile_data(fits,
list_element = 2
)
# Plot one graph from the compiled list
plot(fits_graphs[[1]])
#> Warning: Removed 12 rows containing missing values or values outside the scale range
#> (`geom_line()`).
 # }
# }